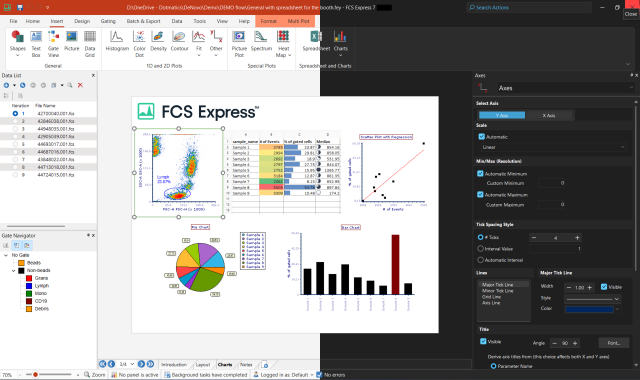
If you have any questions which do not appear on this list, please do not hesitate to contact us directly.

  1. What operating systems does FCS Express run on?
  2. What is your refund policy?
  3. What is a configuration file?
  4. What is a countercode?
  5. What is the difference between the demo, lite and professional versions?
  6. I have saved my layout as a PowerPoint presentation. Can I edit the text in the text boxes or on the plots?
  7. Why are there access violations when I save and load files?
  8. Why does the text on the right-most x-axis label cut off on my plot?
  9. How does FCS Express implement software compensation?
  10. How can I track a population in FCS Express?
  11. Why do I get errors upon exiting FCS Express?
  12. My computer which was running FCS Express had to be replaced. How do I reinstall FCS Express on my new machine?
  13. Why does FCS Express crash immediately upon starting up?
  14. Where is the configuration information for FCS Express stored?
  15. How can I set up FCS Express to read data saved by an Abbott CellDyne Sapphire?
  16. How can I set up FCS Express to read data saved by an Accuri C6?
  17. What are the Resolution Options on the General Category of the plot formatting screen?
  18. Why do my dot plots appear sparse and/or blocky?
  19. Why does the compensation on my Coulter FC 500 data seem incorrect?


ResolutionOptions FAQ

What are the Resolution Options on the General Category of the plot formatting screen?

The general category of the format screen for the 1D and 2D plots contain a section for the resolution options.

 Format Screen Resolution Options

The resolution setting controls how many different bins the final plot will have. 1D plots have the specified number of bins along the X axis, whereas 2D plots have the specified number of bins on the X and Y axis. Thus, a 2D plot with 256x256 resolution (like the image above, will have 65535 different bins for the data to be placed. A general recomendation is that a resolution of not more than 1024 is used for 1D plots, and not more than 256x256 is used for 2D plots.

It is important to note that your data is often in much higher resolution than the number of bins (resolution) that you actually want to use for plotting. The question often arises "Why do I want to use less resolution than my data? Aren't I losing information". The answer is NO, and quite easy to illustrate. Imagine you have an instrument that has 18 bit data, which has a possible 262,144 channels. Now imaging you have aquired only 10,000 cells. That is only a single cell for every 26 channels or so. If the fluorescence values on the cells were completely random, you would only have one cell every 26 channels. We all know that the fluorescence values are not completely random (or evenly distributed), but even with the clustering of data near a central point (like a mean or median) with such an excess of channels compared to number of events, you rarely get many cells in each channel, and it becomes difficult to visualize the "structure" of the data. This is clearly shown in the figure below.

Same data file with 8287 events, plotted in different resolution histograms
262144 resolution
Resolution = 262,144 channels
32768 res
Resolution = 32,768 channels
4096 res
Resolution = 4,096 channels
1024 res
Resolution = 1,024 channels

Lowering the resolution bins more data channels into a single plotted channel. Even though the labels on the axis stay the same, the number of bins that are underlying the histogram are different.  For instance, in the plot on the bottom (1,024 channels), there are 256 data channels in a single plot channel. i.e. any data values falling into channel 0-255 in the listmode data file will be plotted in channel 0 on the plot. The counts on the Y axis are increasing, because more cells are being binned together in an individual channel in the plotted histogram. When comparing histograms from different data files, it is important to make sure that the resolution they are plotted in is the same.

The resolution minimum and resolution maximum settings control which data values mark the start and end of the bins. Data values below the minimum or data values above the maximum will not be included on the plot. These settings allow you to "zoom in" on a certain range of your data and use your full resolution only on a subset of the entire data set, instead of spanning the entire data set. This can be useful if your data spans only a small fraction of the entire plot.

 
De Novo Software