Explore the Scientific R&D Software

Scientific intelligence platform for AI-powered data management and workflow automation
Statistical analysis and graphing software for scientists
Bioinformatics, cloning, and antibody discovery software
Plan, visualize, & document core molecular biology procedures
Proteomics software for analysis of mass spec data
Electronic Lab Notebook to organize, search and share data
Modern cytometry analysis platform
Analysis, statistics, graphing and reporting of flow cytometry data
Intelligent panel design & inventory management for flow cytometry
FCS Express is one of the premier tools for analysis and reporting of your image cytometry data. The application examples below illustrate how FCS Express can be used to create stunning reports while easily performing complex analysis.
Jump to Flow Cytometry Applications.
Would you like to see your Image Cytometry Application in this list? If so, please email us at support@denovosoftware.com.
The BD FACSDiscover™ S8 and A8 combine full spectrum flow cytometry with BD CellView™ Image Technology, capturing a reconstructed image alongside spectral fluorescence data in real time. The example layout below highlights how FCS Express's Image Cytometry features come together to make sense of that combined data set- including image display.
In this example layout:
| The award-winning Invitrogen Attune CytPix Flow Cytometer combines acoustic focusing with a high-speed brightfield camera for simultaneous high throughput flow cytometry and high resolution brightfield imaging. De Novo Software has continued to collaborate with the Thermo Scientific to support both .FCS file and .ACS file exports from the CytPix so FCS Express users can continue to move from raw data to results while maintaining access to images and linking between images, plots, gates, and statistics. |
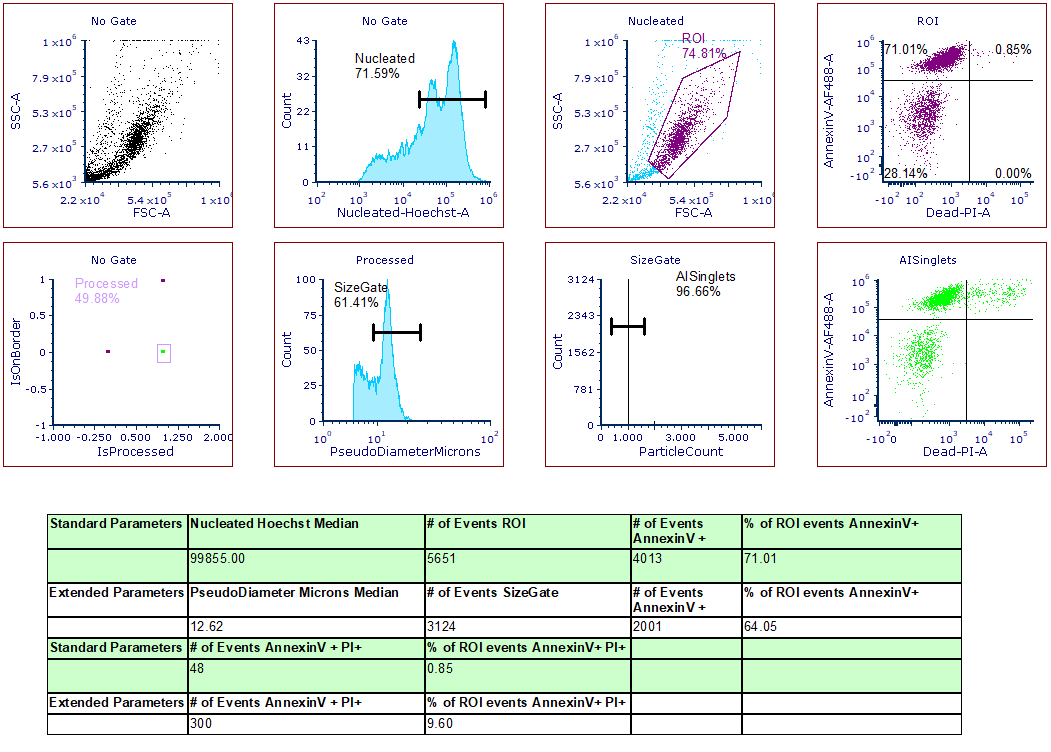
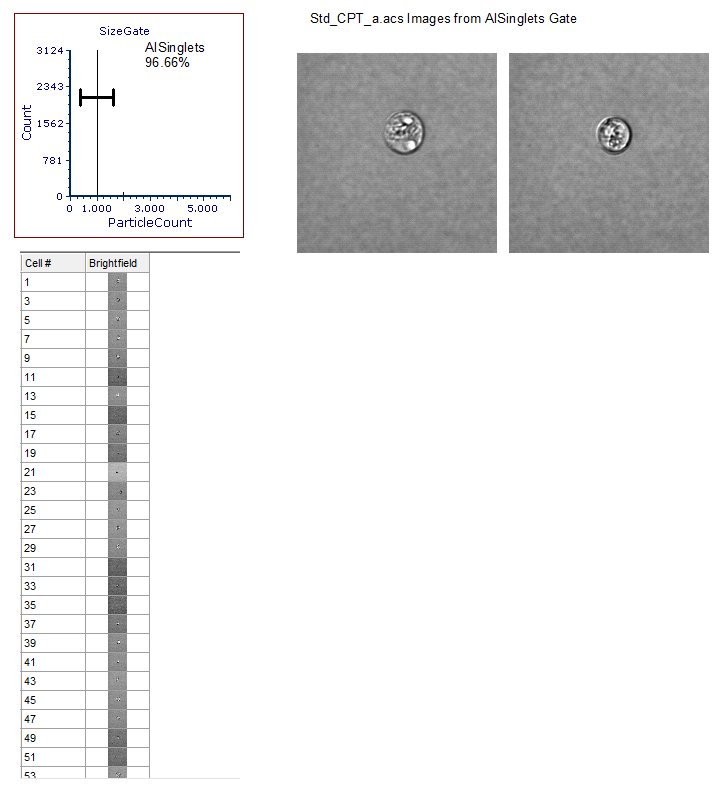
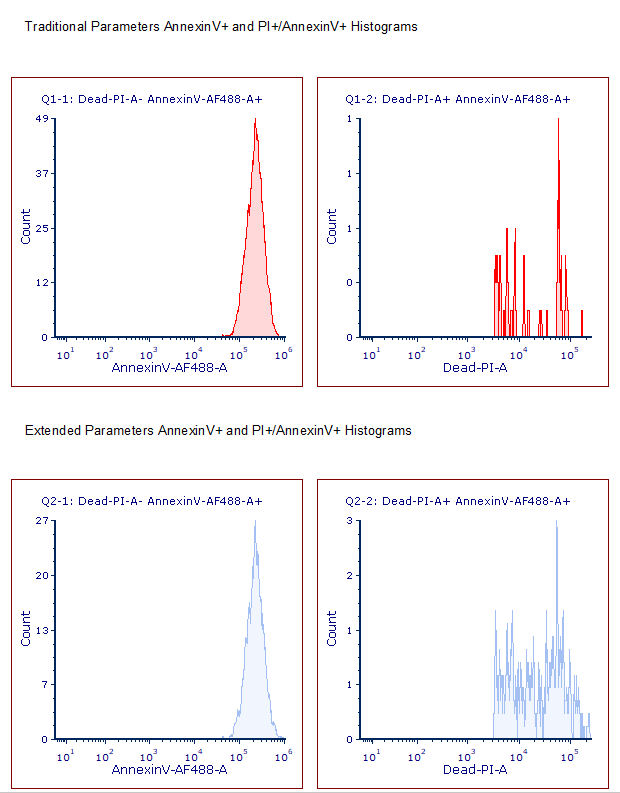
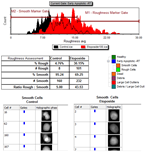
The apoptosis analysis example below outlines an approach to evaluating and assessing apoptosis while working with data from the CytPix, including images. In the example layout, users will find the ability to confirm gating strategies by reviewing images via Data Grids as well as displaying representative images of populations as part of the analysis strategy. The analysis example incorporates a comparison of extended parameters created from the Attune Cytometric Software which have the capability to provide data to confirm singlets with cell count (Particle Count) and morphology features such as roundness (Circularity), size (Area Square), shape (Eccentricity) and complexity (Entropy) to standard parameters. Using image analysis features created by Attune Cytometric software for morphometric parameters like the particle count allows users to quickly and accurately identify populations of interest and confirm gating strategies.
View example images below or download the example layout generated from an Attune CytPix dataset.
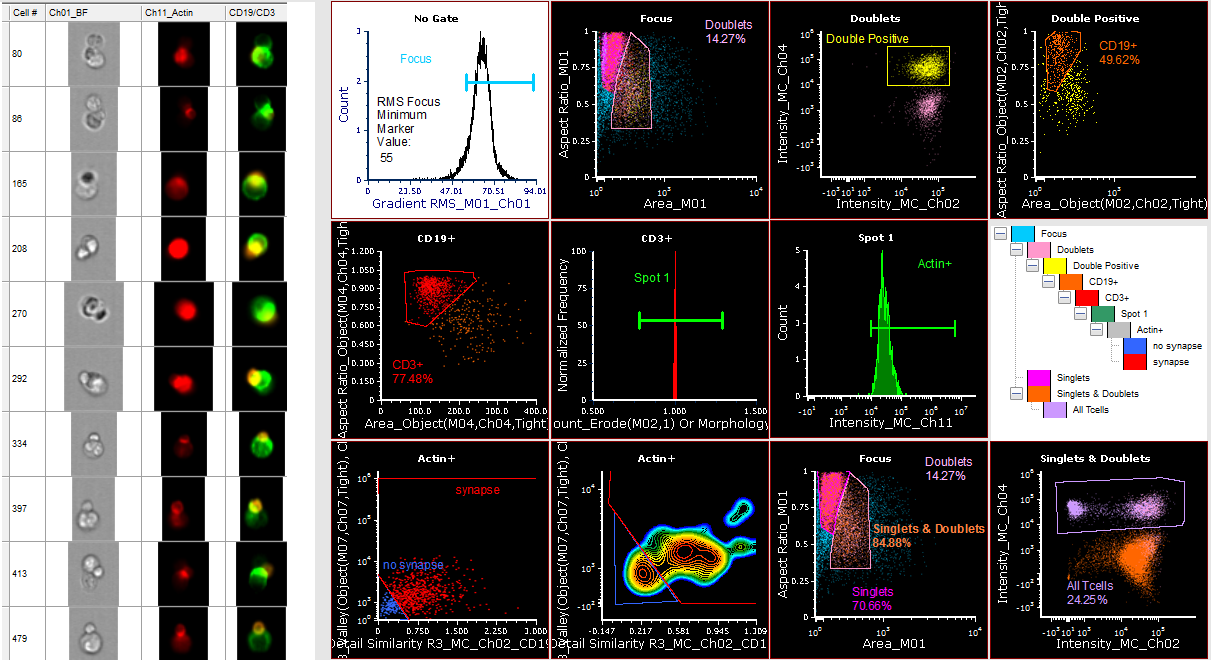
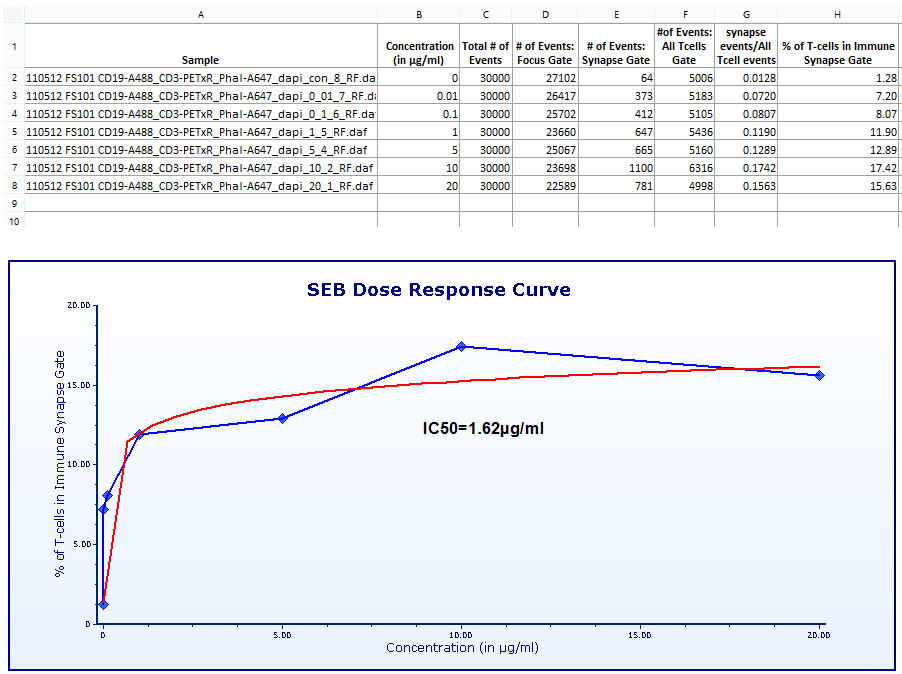
FCS Express allows you to work directly with your Amnis derived data sets in their native .daf / .cif format. Complex analysis routines and workflows are made easy with FCS Express. In the Immune Synapse example see how a complex gating strategy is quickly created, displayed, and reported across a seven point drug titration to create an IC50 curve that updates in real time as gates change. See for yourself by exploring the layout using the free FCS Express Reader: Immune Synapse Analysis.
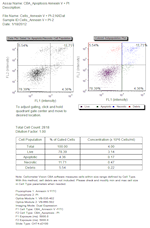
Cellometer Vision was developed to count total cells and identify FITC-annexin-V positive apoptotic cells based on the microscopic and fluorescence characteristics of the cell sample. Detection typically takes less than 60 seconds and only requires 20µl of cell sample. Cell images and all analysis data, including cell size distribution histograms, can be saved for documentation. Data can also be easily exported to FCS Express and utilize the Image Cytometry features for further analysis.
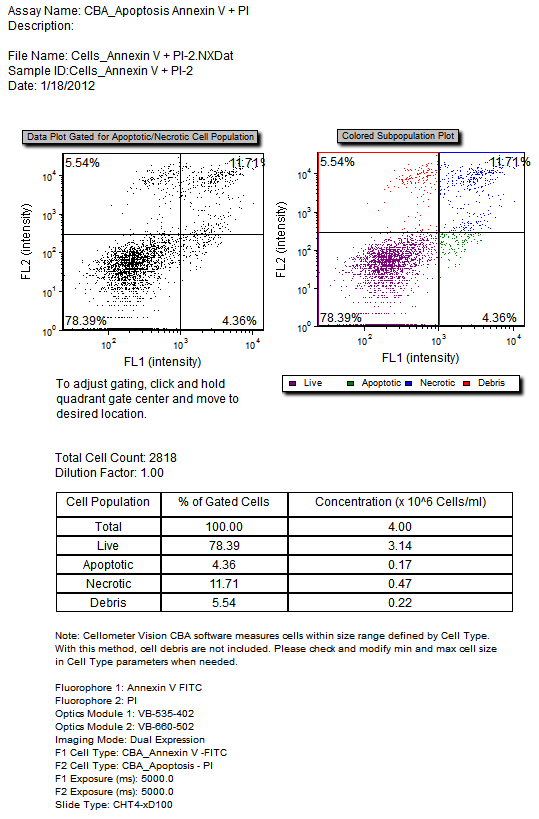
Download and view the layout using the free FCS Express Reader: Nexcelom Apoptosis Assay.
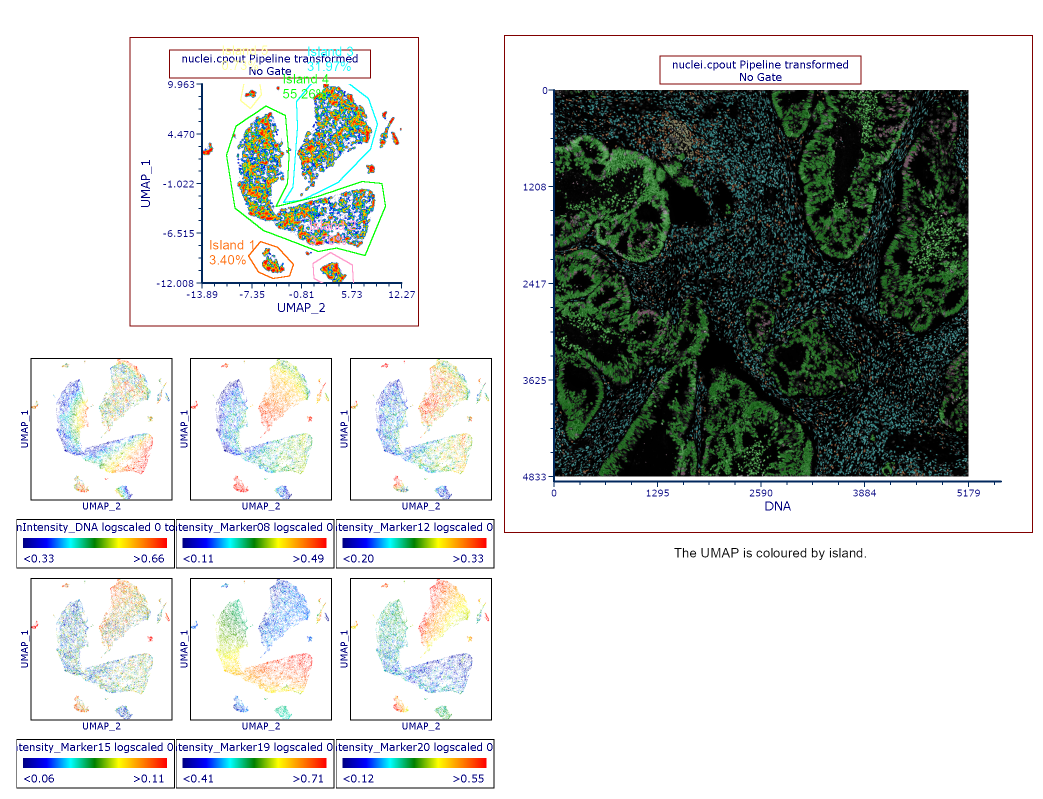
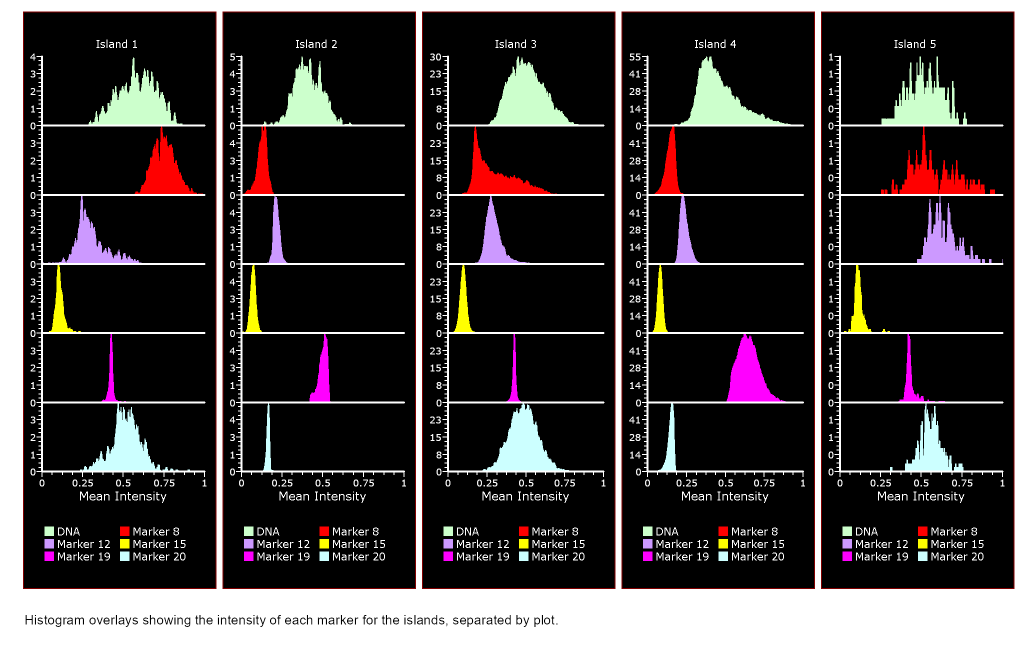
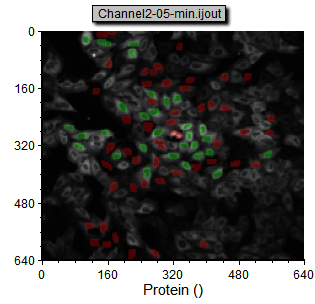
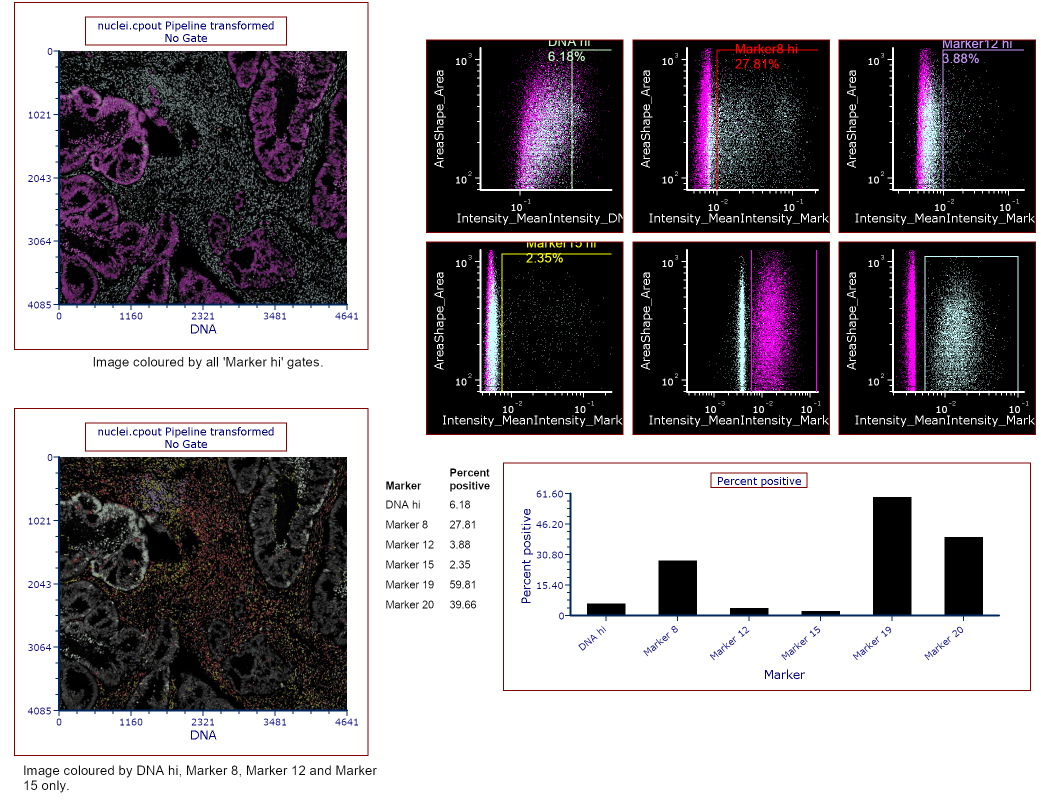
The Orion platform by RareCyte is a spatial biology platform enabling high-plex protein profiling of up to 20 channels per imaging round. Orion enables comprehensive phenotypic profiling and characterization of tissue architecture, tumor heterogeneity, and immune response for whole slide tissue sections. This makes Orion ideal for translational studies, delivering comprehensive spatial insights at high throughput.
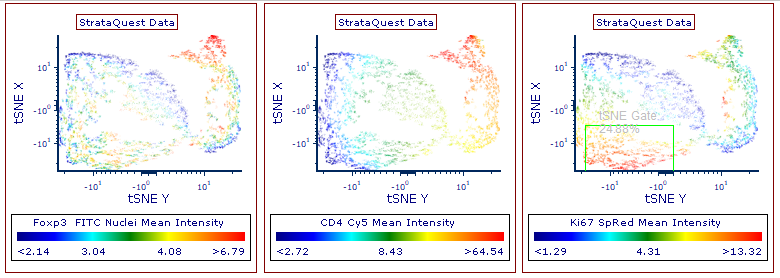
By using cell profiler to segment Orion images, you can analyze high-plex imaging data sets easily in FCS Express. Utilizing the high dimensional analysis tools in FCS Express allows you to explore and interpret your complex cell data with ease.
Download and view the layout using the free FCS Express Reader: RareCyte analysis
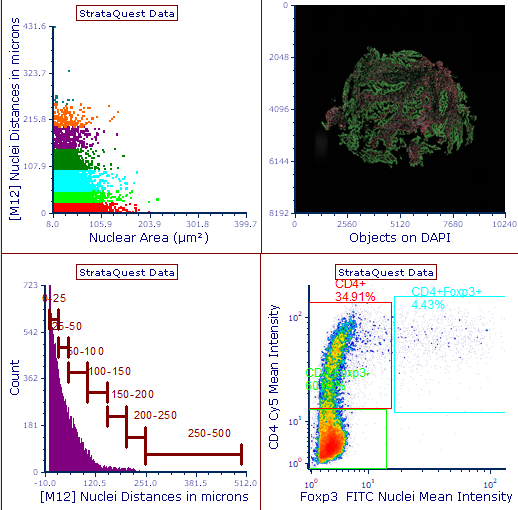
You have carefully planned, implemented, and imaged your multi color in-situ staining experiment resulting in large montaged images containing tens or even hundreds of thousands of cells...now what? After segmentation with CellProfiler, FCS Express can handle these large data sets much like a multi color flow cytometry experiment but with the added advantage of spacial resolution and the ability quickly move from the population level down to individual cells and images.
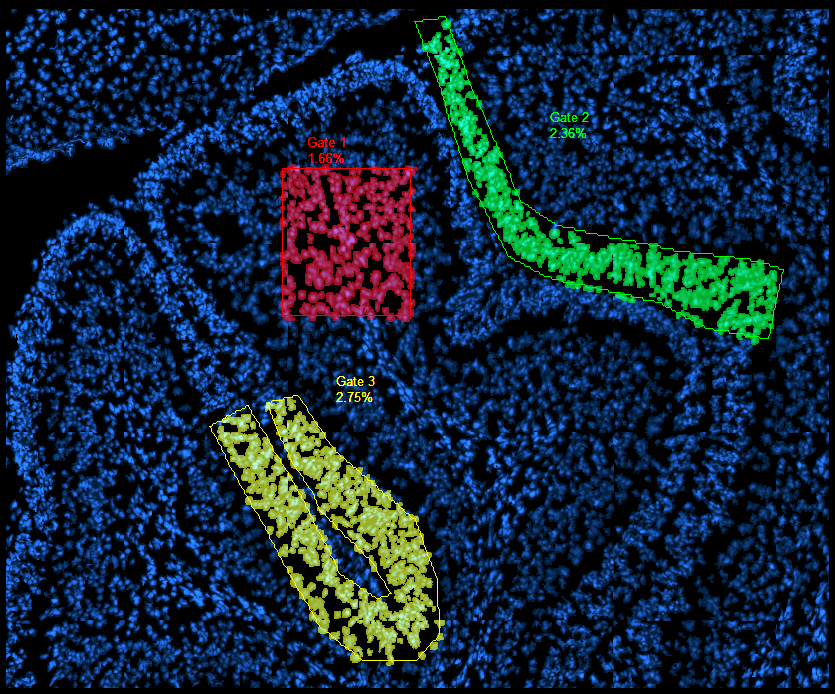
See for yourself by exploring the layout using the free FCS Express Reader: In Situ Rat Cerebellum Staining or download a PDF version: In Situ Rat Cerebellum Staining. You may also download the sample data and run the pipeline yourself using the In Situ Rat Cerebellum Staining Sample Data and pipeline.
Images courtesy of Dragan Maric, Ph.D.
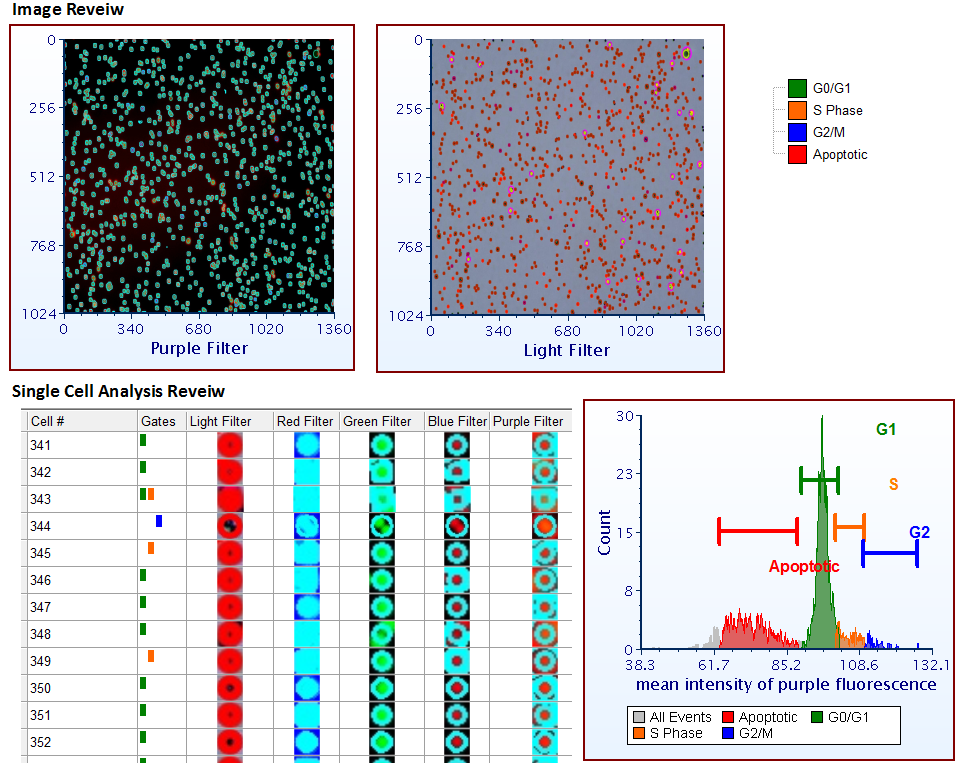
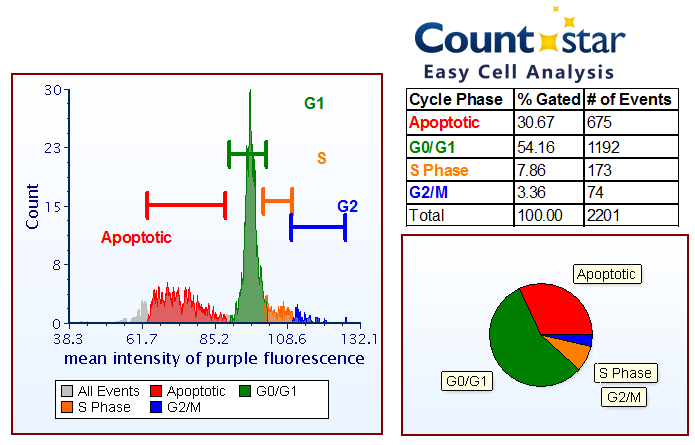
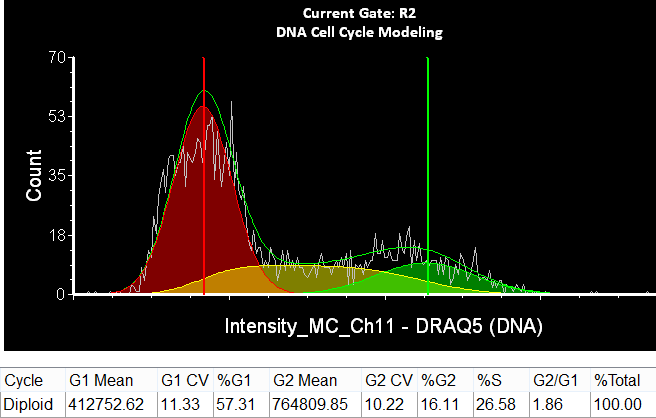
The Ruiyu Countstar Fluorescence Cell Analyzer allows the user to quickly acquire imaging data for cell cycle analysis in FCS Express while retaining links between data points and images. See how easy it is by downloading the PDF version of the layout: Countstar Cell Cycle Analysis PDF or by using the freeFCS Express Reader: Countstar Cell Cycle Assay.
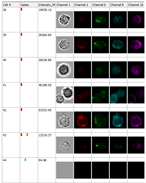
Data from the Amnis IDEAS software package can be exported for use in FCS Express. Use FCS Express to navigate between plots and images in real time, create custom statistics, and export directly to PowerPoint for quick and easy presentation of your data.
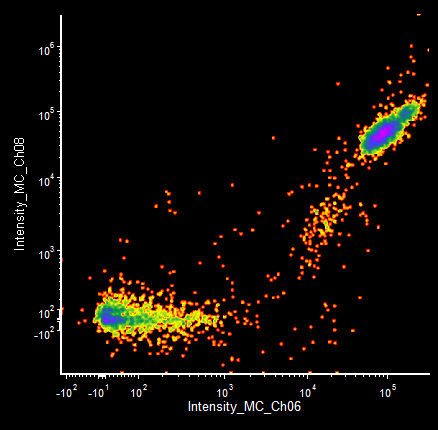
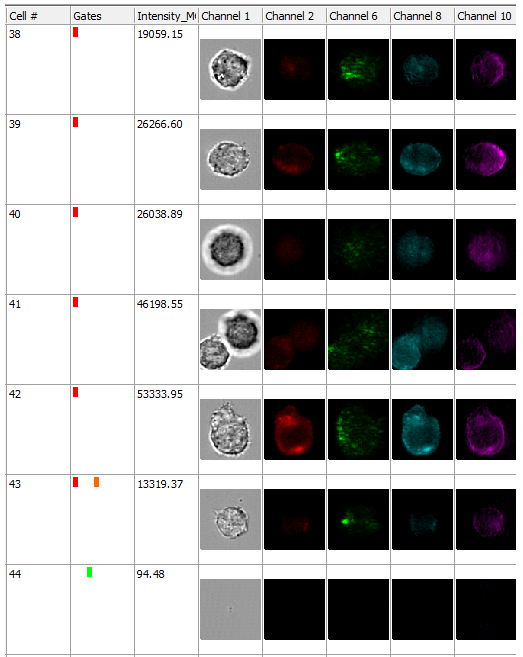
See for yourself while learning FCS Express by exploring Image Cytometry analysis features in the layout using the free FCS Express Reader: Image Cytometry Data in FCS Express or download a PowerPoint version: Image Cytometry Data in FCS Express PowerPoint.
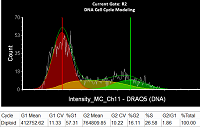
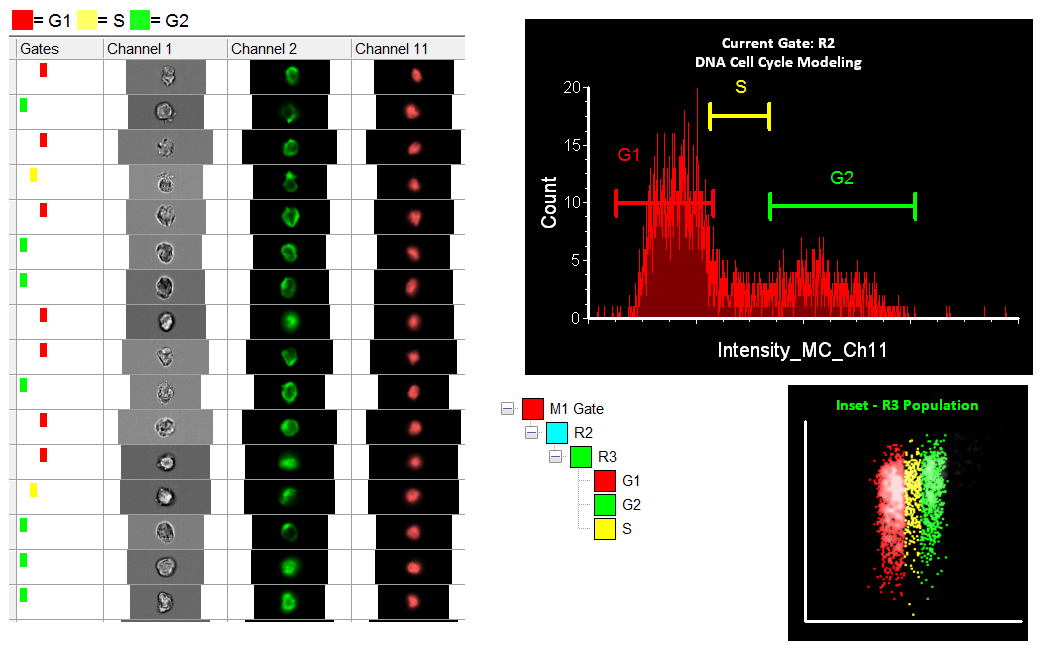
DNA Cell Cycle analysis and modeling is easy to perform with Amnis IDEAS derived data sets in FCS Express using the Image Cytometry features. Use Multicycle to generate powerful cell cycle statistics and batch process your image cytometry data to analyze and archive your results in record time. See for yourself by exploring the layout using the free FCS Express Reader: Amnis (IDEAS) Analysis with Multicycle in FCS Express or download a PDF version: Amnis (IDEAS) DNA Analysis PDF.
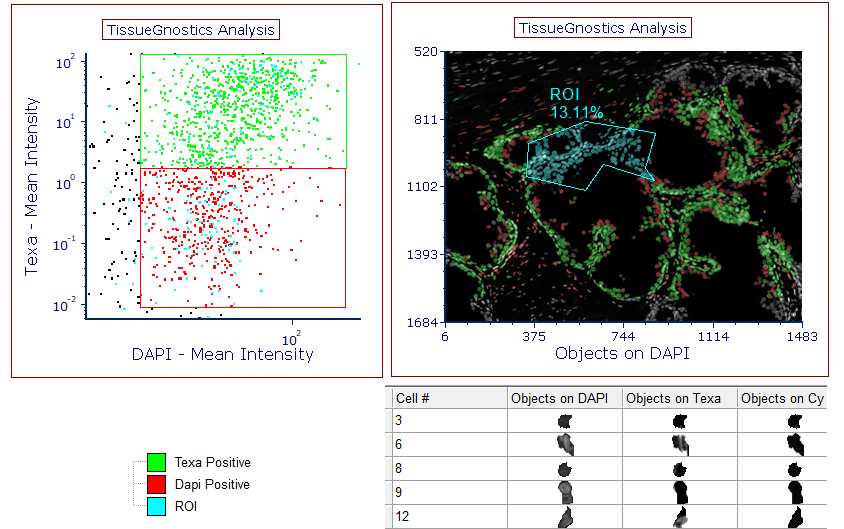
TissueGnostics and De Novo Software have collaborated by combining expertise in Image Cytometry. The collaboration provides a streamlined workflow that enables researches to quickly obtain publication-ready results from IF/IHC processed tissue sections. TG’s tissue cytometry-based technology permits the automated scanning of tissue sections, (thereby creating a virtual slide), contextual analysis-based quantification of stained cells/structures and raw data mining. The data obtained can be opened in De Novo Software’s FCS Express and utilize the available Image Cytometry features, this allows scientists to create publication ready charts, visualizations, and displays coupled with access to advanced statistics, high-dimensional data reduction tools, and machine learning algorithms.
Cellomics best-in-class technology integrates automated instrumentation, image analysis modules, multi-parametric assays, validated reagents and cell lines and cellular bioinformatics tools to achieve a flexible, broadly applicable platform for users in the life sciences who need to understand cell function. FCS Express and the available Image Cytometry features compliment these systems by providing easy to use software with robust reporting, statistical, and batch processing features.
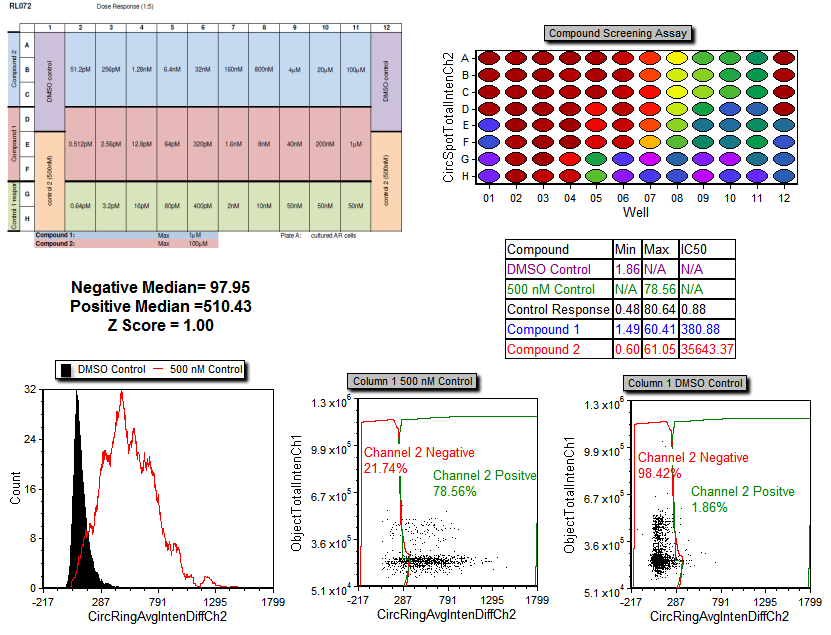
FCS Express works at the single cell level and dose response curves update dynamically as gates are adjusted. See for yourself while learning FCS Express with our Introduction to FCS Express using Image Cytometry features tutorial. You may also explore the layout using the free FCS Express Reader: Cellomics Dose Response Assay or download a PDF version: Cellomics Dose Response PDF.
Download the PDF version of the layout: Tali Cell Cycle Assay PDF or download and view the layout using the free FCS Express Reader: Tali Cell Cycle Assay.
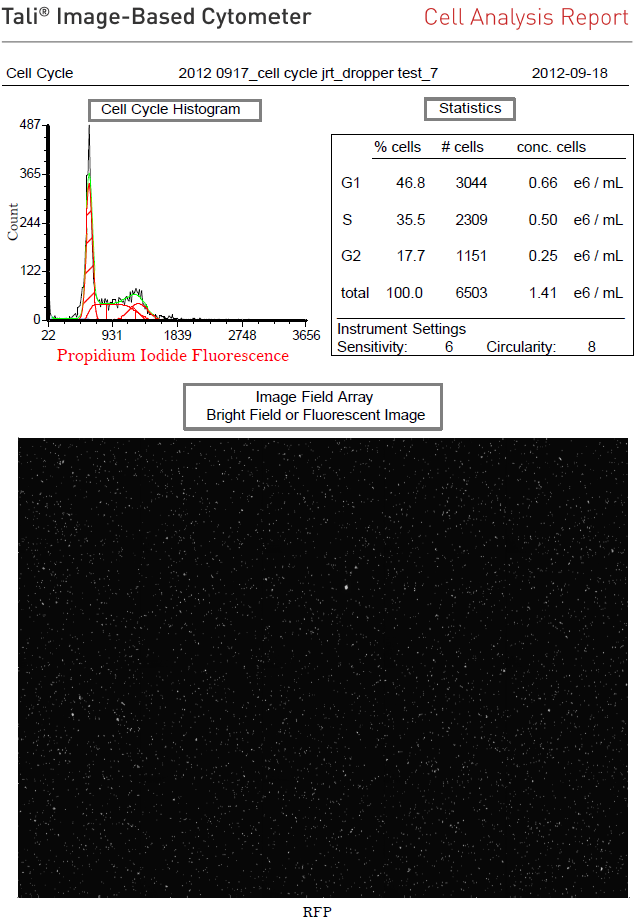
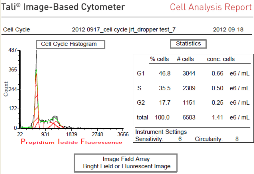
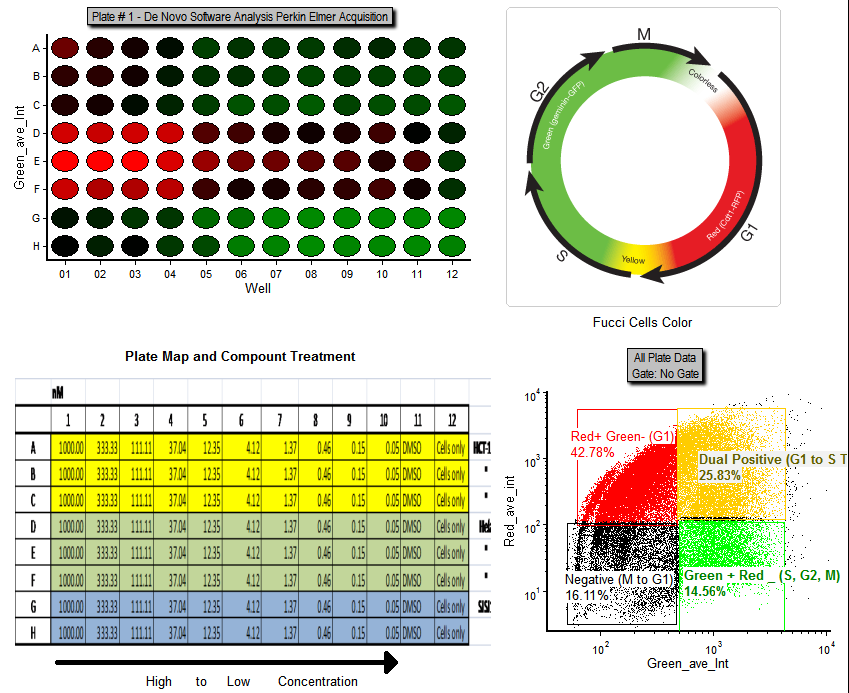
The Tali Cell Cycle Kit allows you to easily stain and identify the cell cycle in a number of cell lines and the Tali data can then be exported to FCS Express. Utilizing the Image Cytometry features included in FCS Express to analyze the Tali data with the Multicycle cell cycle analysis you can quickly and easily get an accurate and powerful break down your cell cycle populations and use statistics provided by FCS Express to dive further into your analysis.
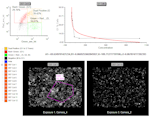
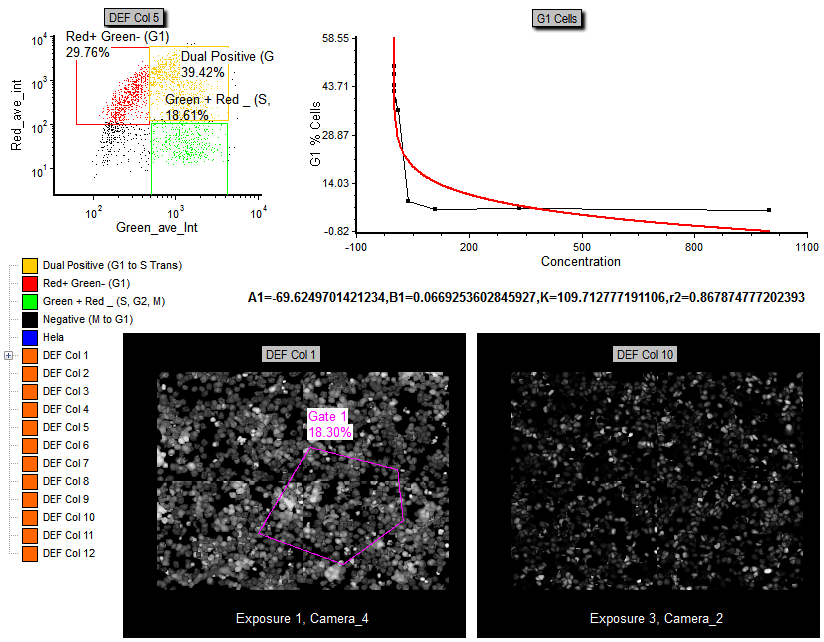
Incorporating industry-leading optical technologies, PerkinElmer's Opera® High Content Screening System continues to be the world's most proven confocal microplate imaging solution for high throughput High Content Screening. FCS Express and the Image Cytometry features compliment these systems by providing easy to use software with robust reporting, statistical, and batch processing features. FCS Express works at the single cell level and dose response curves update dynamically as gates are adjusted.
See for yourself while learning FCS Express with our Introduction to FCS Express using Image Cytometry features tutorial. You can also take a closer look by downloading the Opera Dose Response Powerpoint export for this experiment.
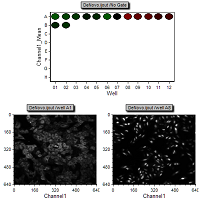
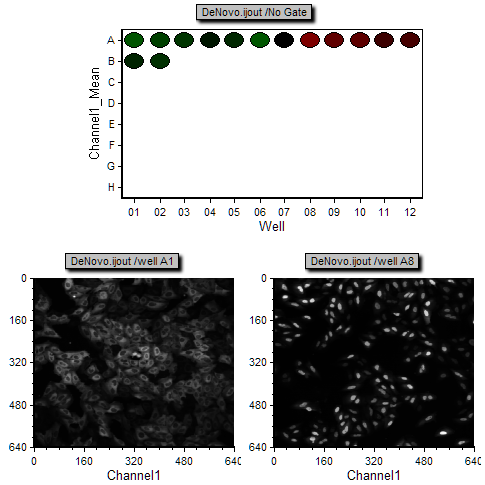
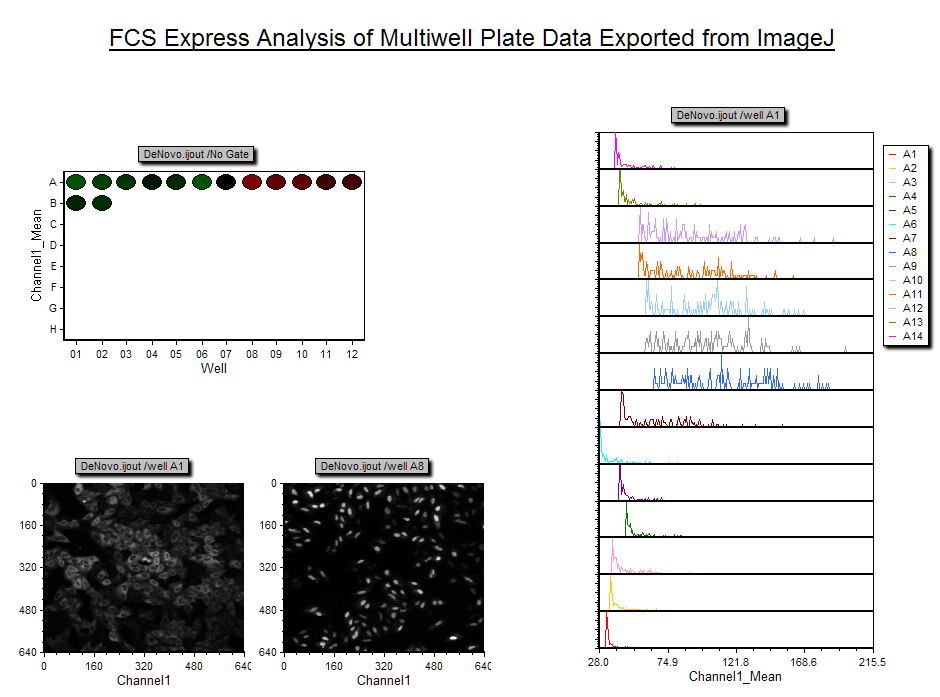
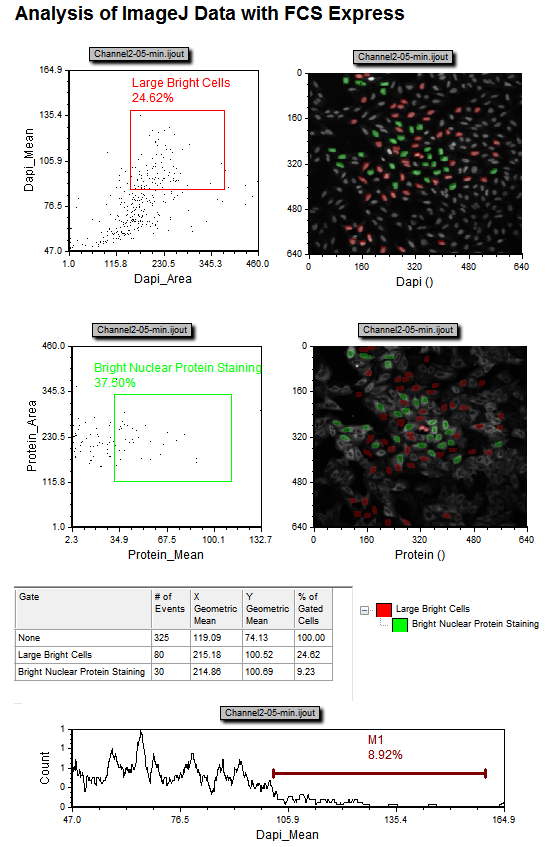
Multiwell plate data processed in ImageJ can be exported using ImageJ macros from De Novo Software and analyzed with FCS Express. You may also explore the layout using the free FCS Express Reader: Image J Analysis with FCS Express or download the PDF version: ImageJ Research Imaging PDF.
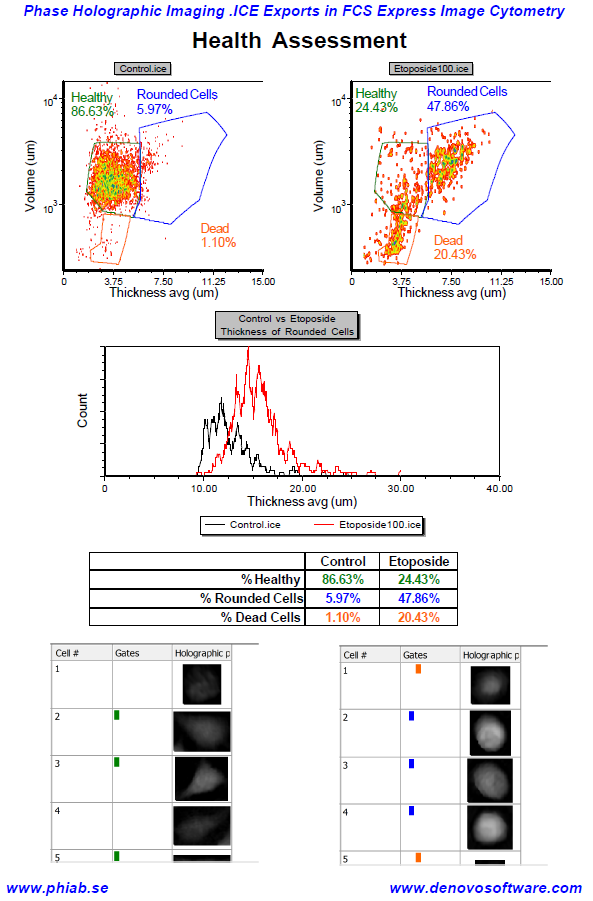
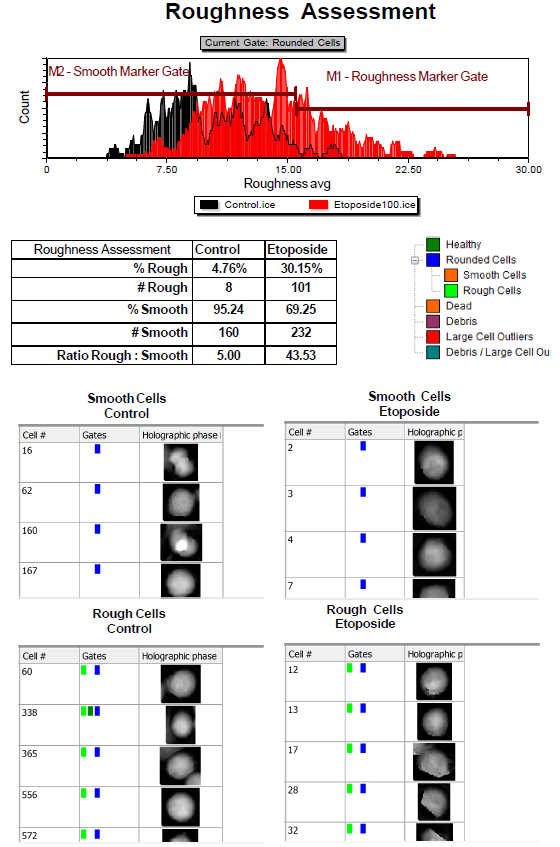
Phase Holographic Imaging now enables exporting Image Cytometry Experiment files from the HStudio software. The holographic images and derived numerical data acquired on the HoloMonitor instrument can now be analyzed in FCS Express. See what holographic imaging can do by using the free FCS Express Reader to open: Phase Holographic Imaging Data or download the PDF version: Phase Holographic Imaging Data in FCS Express.
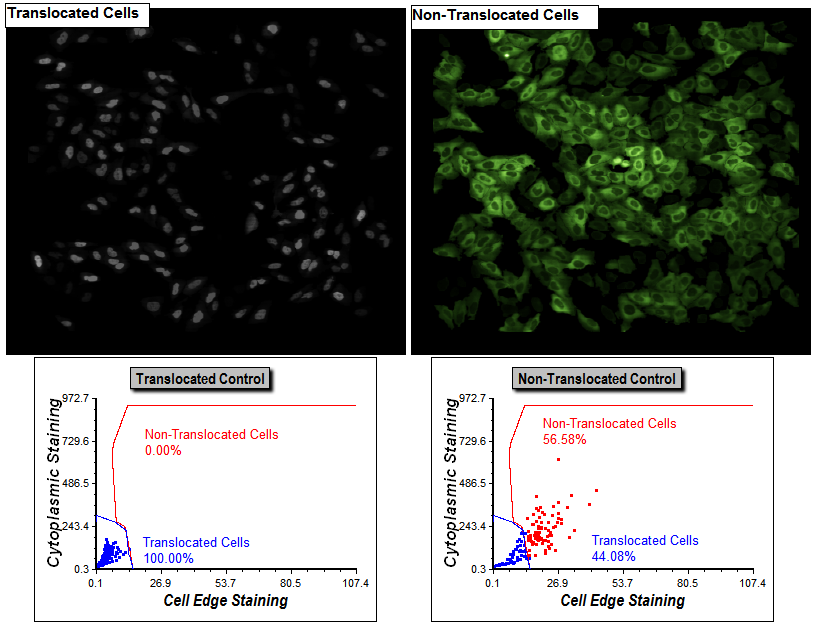
FCS Express can be used to organize, analyze, and get results from any imaging experiment. By using CellProfiler to segment your images you can analyze the simplest single image experiments to complex multi-time point and multi-color assays in FCS Express. See for yourself while learning FCS Express with our CellProfiler Export tutorial.
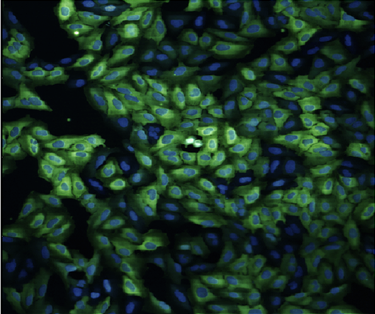
You may also explore the layout using the free FCS Express Reader: Nuclear Translocation Assay with CellProfiler Segmentation or download a PDF version: Research Imaging PDF
FCS Express can also be used in conjunction with ImageJ to get data from your images. By using ImageJ to segment your images and macros from De Novo Software you can quickly export and analyze your data with FCS Express. See for yourself while learning FCS Express and exploring the available Image Cytometry features with our ImageJ Export tutorial. You may also explore the layout using the free FCS Express Reader: Image J Analysis with FCS Express or download a PDF version: ImageJ Research Imaging PDF.
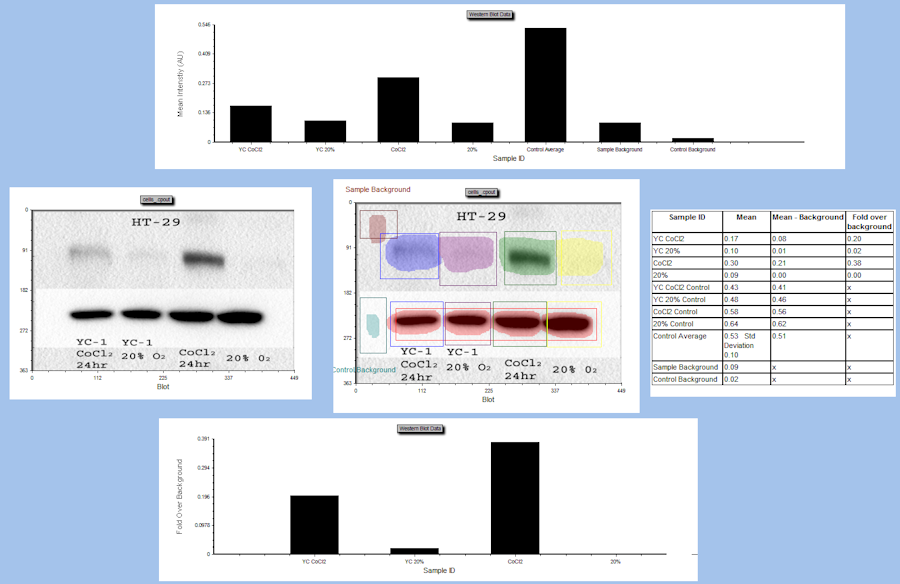
FCS Express can be used to analyze any images and that includes western blots. By using CellProfiler to identify lanes and bands on a western blot image, you can gather band intensity data. You can then compare that data directly to your complimentary image and flow data all in one package.
Explore the layout using the free FCS Express Reader: Western Blot and Image Analysis with CellProfiler Segmentation or download a PowerPoint version: Western Blot and Imaging PPT.
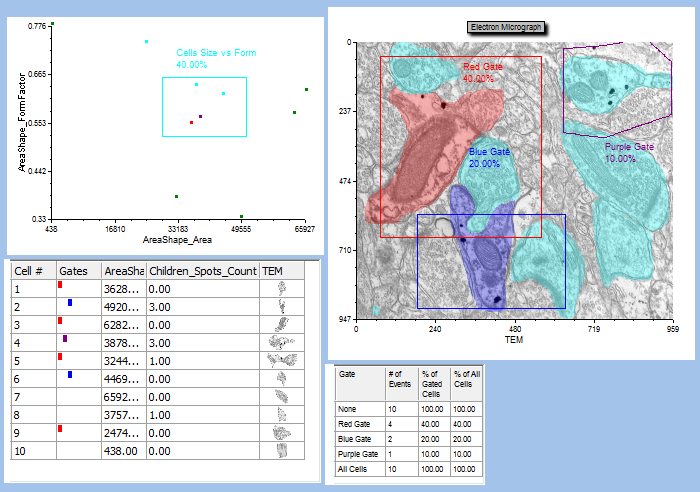
FCS Express can be used in conjunction with segmentation software for analysis of TEM Images. By using CellProfiler to identify cells and gold labeled antibodies a complete analysis of your micrographs can be completed. You can then compare that data directly to your complimentary flow cytometry data all in one package.
Explore the layout using the free FCS Express Reader: TEM Analysis with FCS Express or download a PowerPoint version: TEM Analysis PPT Export.
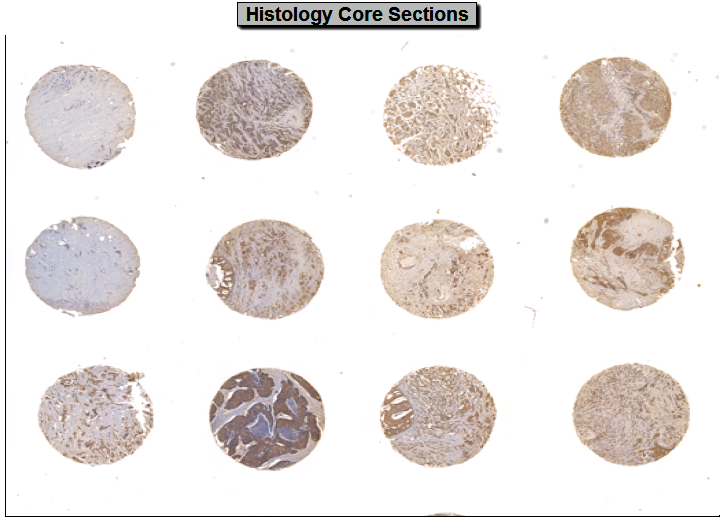
Generating large data sets to look at multiple tumor core histology sections has become relatively easy with new imaging technology although bottle necks usually occur during the analysis step. Now with FCS Express by using the Image Cytometry features making sense of the data and analyzing it quickly is made easy with the use of interactive plots and batch analysis.
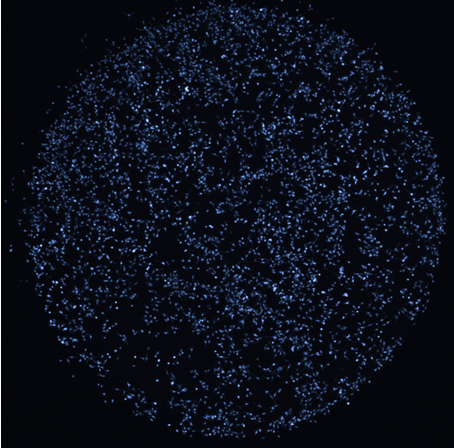
See for yourself by exploring the layout using the free FCS Express Reader: Histo Core Analysis or download a PDF version: Histo Core Analysis. You may also download the sample data and run the pipeline yourself using the Histo Core Analysis Sample Data and pipeline.
Images courtesy of Michael Samuel, Ph.D.
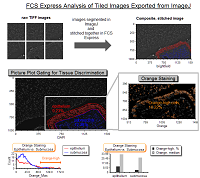
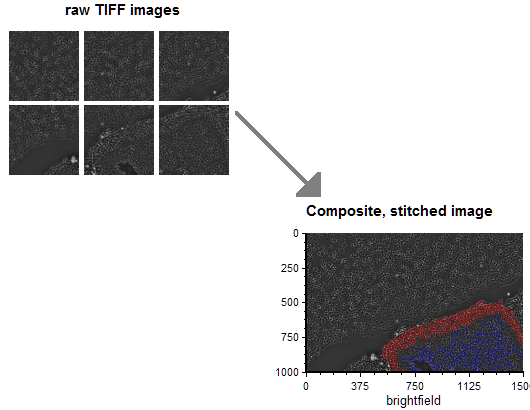
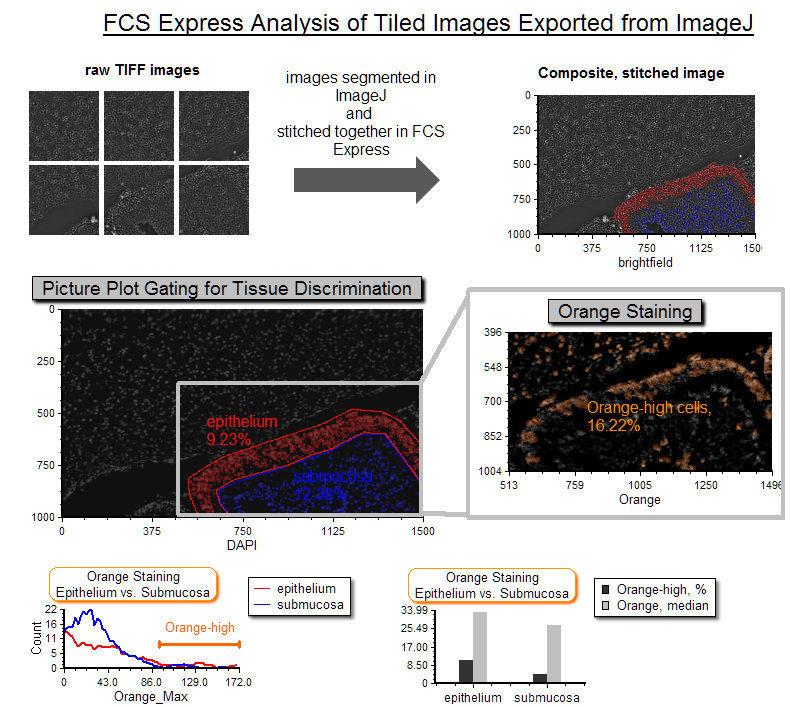
Histological sections with tiled images (i.e., contiguous fields of view) which have been segmented in ImageJ can be exported and stitched together in FCS Express, using ImageJ macros from De Novo Software. You may explore the layout using the free FCS Express Reader: Image J Analysis of Tiled Images with FCS Express or download the PDF version: ImageJ Tiled Images PDF.
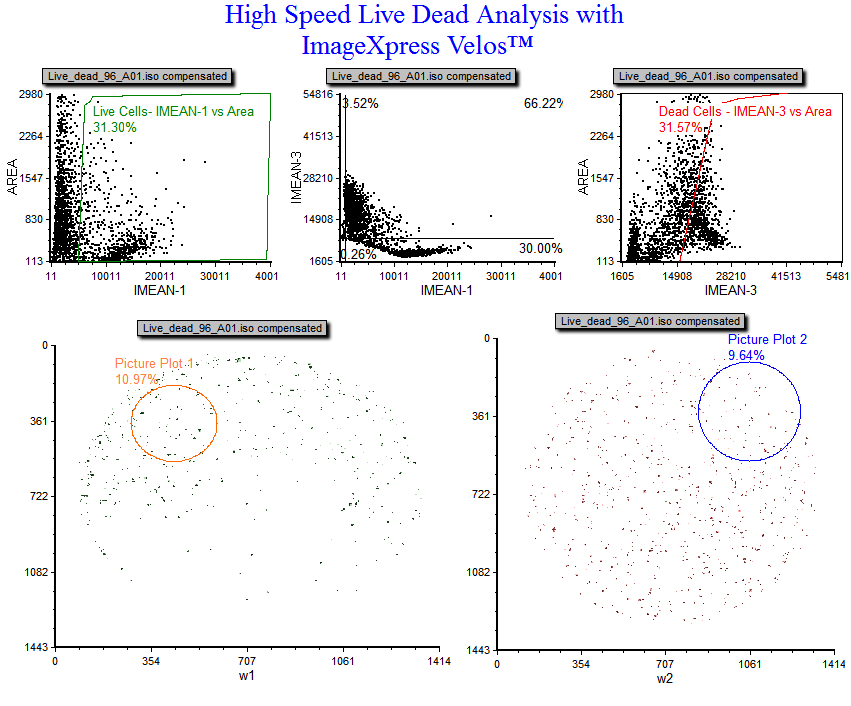
The ImageXpress Velos allows you to image and segment entire plates (6 to 1536-well) in less than 5 minutes. FCS Express and the included Image Cytometry features now support Velos data and complements your high speed analysis with in depth multiparametric capabilities. Try for yourself while learning FCS Express with our Exporting from IX Velos tutorial. You may also explore the layout using the free FCS Express Reader: IX Velos Data Analysis in FCS Express or download a PDF version: IX Velos Data Analysis PDF.
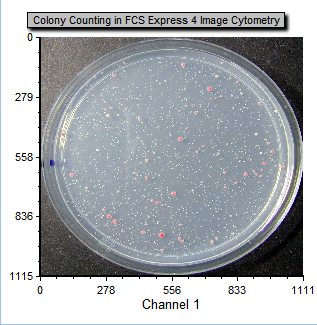
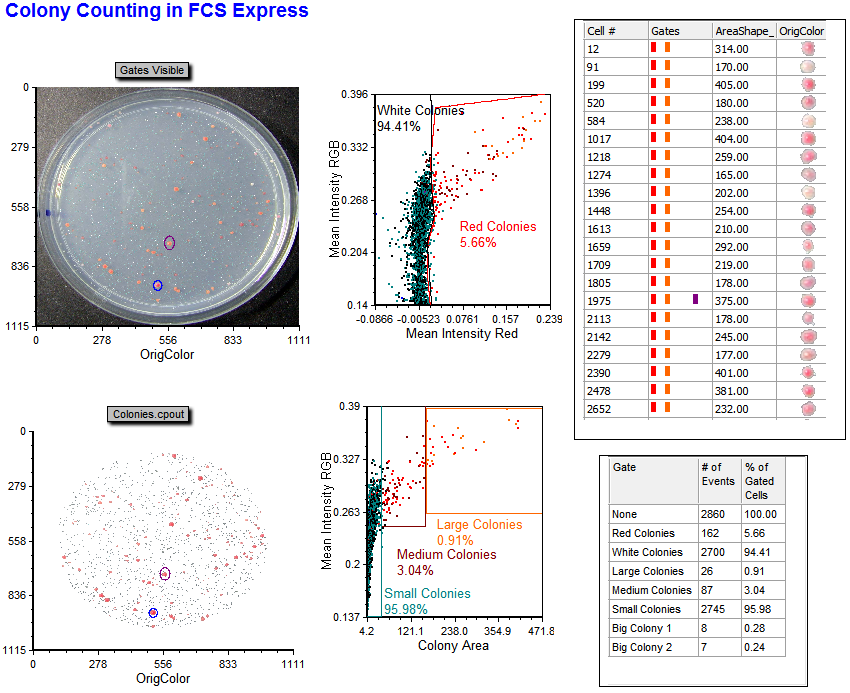
Colony counting can be a tedious task at best. Let FCS Express with Image Cytometry features do the counting and classification for you so you can spend more time getting to results. Explore the layout using the free FCS Express Reader: Colony Counting in FCS Express or download a PDF version: Colony Counting PDF. You may also download and run the pipeline yourself using the CellProfiler colony counting pipeline adapted for FCS Express.
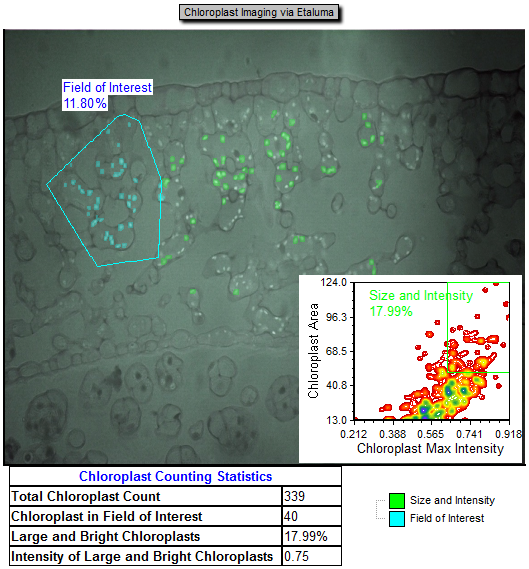
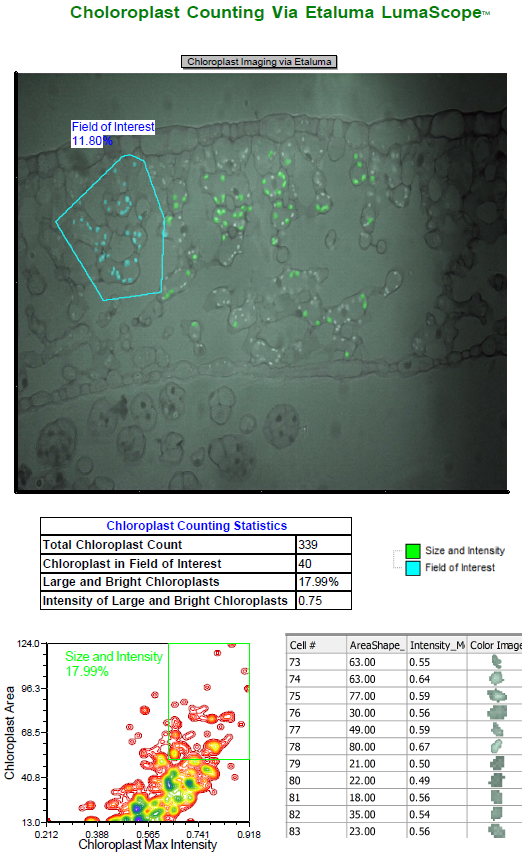
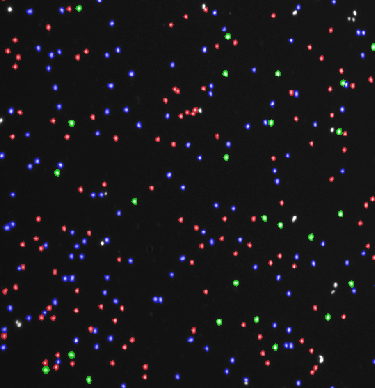
Etaluma Inc., maker of the LumaScope, is focused on bringing analytical and diagnostic instrumentation to a greater spectrum of users. The LumaScope™ provides fluorescence and bright field capability in an inexpensive inverted microscope and when images are segmented by CellProfiler single cells and objects can easily be analyzed in FCS Express utilizing Image Cytometry features. See for yourself by downloading the PDF version of the Chloroplast Analysis layout, or by using the free FCS Express Reader: Chloroplast Analysis.
In the Chloroplast Analysis example a bright field and fluorescent image were taken to highlight the distribution of the Chloroplast. FCS Express enables the user to quickly count and categorize chloroplasts in the image.
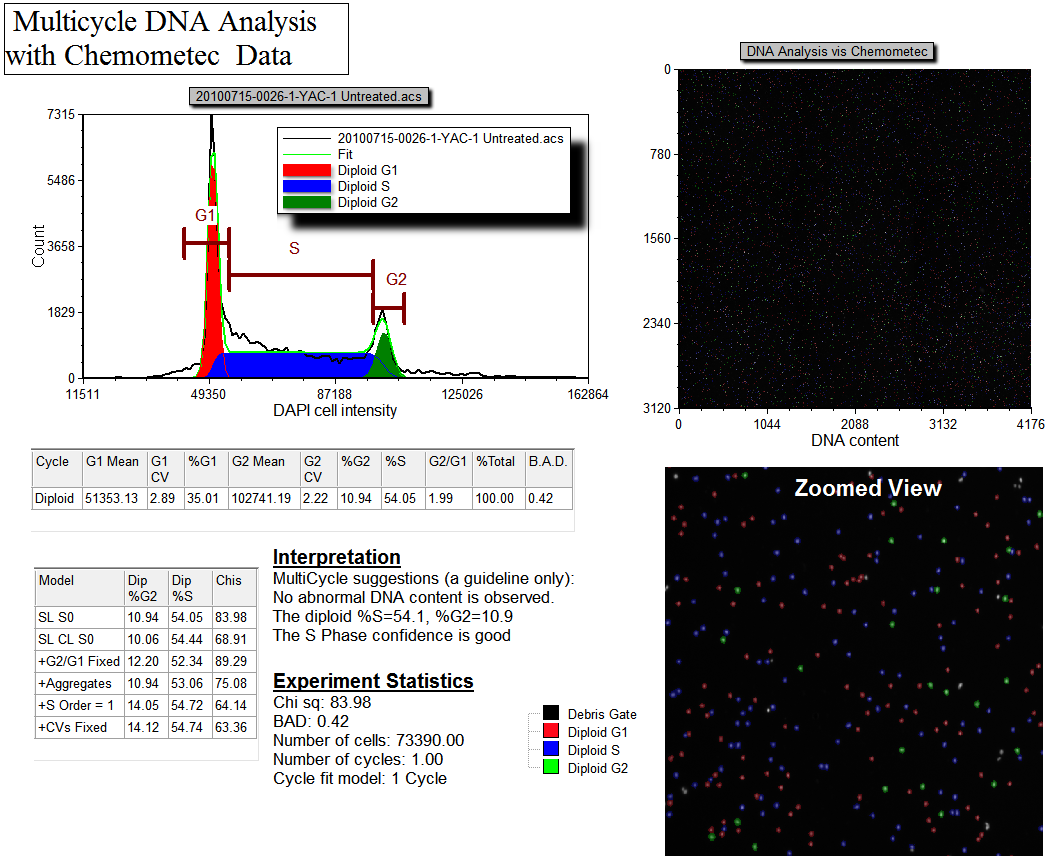
The Chemometec NucleoCounter makes acquiring DNA content data from slides quick and easy. FCS Express and the available Image Cytometry features now makes analysis of your images and getting to results just as simple. Use Multicycle to generate powerful cell cycle statistics and batch process your image cytometry data to analyze and archive your results in record time. See for yourself by exploring the layout using the free FCS Express Reader: Chemometec Analysis with Multicycle in FCS Express or download a PDF version: Chemometec DNA Analysis PDF.
Would you like to see your Image Cytometry Application in this list? If so, please email us at support@denovosoftware.com.
NucleoCounter is a registered trademark of Chemometec.
NC-3000 is a trademark of Chemometec.
Cellometer is a registered trademark of Nexcelom.
Opera is a registered trademark of PerkinElmer